“It would be absurd to imagine that the mechanical diagrams have any representation in the world of fact. They are figments of the imagination and may serve some useful purpose as picture books serve in teaching a child the alphabet.”
Henry Smith Williams and James Beveridge in the 1915 book The Mechanism of Immunization
When I originally went scouring through the history of “antibody” research back in April 2021, I was primarily searching for two key pieces of evidence: first, I wanted to see if researchers had ever actually demonstrated that they had purified and isolated the so-called “antibodies” directly from the serum of a host and fully characterized these entities. Second, I wanted to see if they had ever taken these purified and isolated entities and demonstrated experimentally that, by exposing them to a sample containing a purified and isolated pathogenic “virus,” this actually resulted in the assumed effects of the “antibodies” attaching to, and ultimately eliminating, the “virus.” Since I knew through my prior research that finding purified and isolated “viruses” was an impossibility, I anticipated that finding the evidence I sought for the much smaller “antibodies” would be a rather tall order. Regardless, if researchers were able to achieve purification and isolation of the “antibodies,” I wanted to see clear electron microscope images of these Y-shaped particles looking exactly as they are depicted through computer-generated artist renderings in the textbooks, the mainstream media, and the scientific literature. I sought direct clear visual evidence that these uniquely shaped substances existed within the fluids as described, and not only as cartoons and models.
As noted by the 1993 paper Ehrlich's "Beautiful Pictures" and the Controversial Beginnings of Immunological Imagery, it is a belief that “antibodies” are biochemical entities in the blood, and the idea of these entities as Y-shaped molecules is due to the popularization of the images found in textbook, scientific articles, advertisements, and even as logos in biotech companies.
“The term antibody today refers to discrete biochemical entities present in the blood. The belief that antibodies are such entities is held not only by scientists and physicians, but also by the lay public, who learns about "antibodies," if not in school, then at least in the course of routine medical practices such as vaccination and, increasingly, through the so-called popularization of science. In addition, some people will readily associate the term antibody with the characteristic Y-shaped structure found not only in textbooks and specialized scientific articles but also, more recently, in advertisements and even as the logos of pharmaceutical and biotechnology companies.”
The authors of the paper ultimately concluded that, from the time of Paul Ehrlich and his original drawings of the invisible “antibody” entity, there was a conceptual move away from directly observable phenomena to the inference of invisible entities or processes (such as “immune” responses), based upon macroscopic experimental reactions that were created in the lab.
“Beyond this point, what seems to us to be the central issue in Ehrlich's endeavor is the establishment of a domain of invisible specimen behavior and the correlative conflation of observable macroscopic experimental reactions (agglutinations, precipitations, and so forth) with invisible combinations of newly constituted entities. As a result of this conflation, the performance of immunological experiments and the constitution of new immunological entities became the two sides of a single representational coin.”
Upon doing so, a representational short-cut was created where these observable reactions were conflated with presumed, but yet entirely unseen, biological entities and mechanisms. These abstract entities were then regarded to be as “real” as the observable outcomes, despite the lack of any direct evidence to their existence. This conflation obscured the distinction between what is directly measurable and what is inferred by the researchers, raising questions about the validity of the conclusions drawn from such experiments. It created the opportunity for researchers to lose sight of the fact that these drawings are hypothetical representations of unseen entities and processes that have not been proven to be a direct reflection of reality.
The “antibody” is a conceptual model that originated with Ehrlich and evolved over time into its current Y-shaped imagery in order to be used to explain certain chemical reactions that were observed in immunological experiments, such as agglutination (clumping of particles together) or precipitation (soluble reactants that come together to make one insoluble product, the precipitate). However, despite what the scientific literature states, models might not accurately represent what is actually happening in reality, especially when dealing with what was coined the “domain of invisible specimen behavior.” Problems arise when researchers treat these abstract representations as if they are direct reflections of reality when they are, in fact, simply constructed explanations using models based upon observed reactions. Conflating what can be empirically observed with that which is entirely theorized leads researchers to make assumptions about invisible processes that are not fully substantiated by the data from their experiments. They end up fitting their experimental results to the model in order to make things “work.”
Echoing virology, I knew that for most of the time immunologists claimed to be working with these entities, no direct visual depictions actually existed. The “antibody,” like the “virus,” began simply as a conceptual idea to explain lab-created effects. Starting with this understanding, I wanted to pinpoint exactly when these entities were first claimed to be observed in reality. After searching through the main research papers from 1890 to the 1970s, I could find no direct evidence that “antibodies” were the Y-shaped proteins they had been depicted as over the years. I wanted to know if there were any actual images of these particles and what methods were used to generate these depictions. Were the images of purified, isolated particles taken directly from the serum? Were they unadulterated, or were they computer-generated reconstructions fitted to a framework or model?" Presented here is what I was able to uncover at that time, along with additional commentary and research done recently, looking into the origins of the depictions of the Y-shaped “antibody.”
After reviewing the most significant moments and papers in the history of “antibody” research, it became evident that none of the highlighted achievements in these timelines mentioned any images of purified and isolated “antibodies” imaged directly from the serum. Instead, researchers relied on indirect results from chemistry experiments, using these findings to hypothesize about the possible molecules present, their appearance, and their presumed functions based on this indirect evidence. I found it impossible to locate the first-ever image of a purified and isolated “antibody,” which leads me to question whether such an image even exists. It is rather strange that direct imaging that would reveal the Y-shaped particle is conspicuously absent from the key milestones in “antibody” history.
The closest mention to any imaging that I could find was from Nature's “The History of Antibodies” timeline, where it is noted that Enid W. Silverton, Manuel A. Navia and David R. Davies presented the first three-dimensional structure of an immunoglobulin in their 1977 paper Three-dimensional structure of an intact human immunoglobulin. Before discussing the findings in this paper, the authors mentioned that an allosteric model of an “antibody” had previously been proposed based on X-ray diffraction results. X-ray diffraction is a technique where it is claimed that X-rays are reflected from the atoms in a crystalline solid, and these diffracted X-rays generate a pattern that reveals structural orientation of each atom in a given compound. An analogy of how this process works would be shining a light on an object and observing the shadow it casts. However, instead of using visible light, X-rays are used, and instead of a simple shadow, the pattern created is considered to be much more intricate. When the X-rays hit a crystallized protein or “antibody,” they scatter in various directions, creating a “shadow” pattern. The researchers then analyze this pattern and use it to reconstruct a 3D model of the object that caused the scattering. In this way, just as you could infer the shape of an object from its shadow, researchers use the scattered X-rays to deduce the structure of the molecule. However, rather than directly observing the object itself, they rely on this “shadow” (the diffraction pattern) to piece together the 3D structure.
There are valid criticisms and concerns with this technique. If multiple objects (or parts of a molecule) are closely packed together or overlap, the resulting “shadow” (diffraction pattern) could be a blend of signals from various different objects. This means that the final model, which is reconstructed from this pattern, might not accurately represent the individual components or their true arrangement, especially as there are no direct images of the “antibody” to confirm that the shadow pattern accurately represents an entity that exists in nature. In other words, the model could be simply an approximation or an interpretation that doesn’t fully capture the complexity of what’s actually creating the diffraction pattern. The process assumes a certain structure when fitting the model, so if multiple objects are influencing the pattern, it could lead to a model that is misleading. What is modeled may not reflect anything found in nature and could simply be a creation of the process itself.
The authors of the 1977 paper referenced the model created by analyzing light diffraction patterns from crystallized proteins, claiming to deduce the three-dimensional structure of “antibodies” in order to build it. This model was from their prior research, a 1975 paper titled Immunoglobulin Structures at High Resolution that was printed from in the book Contemporary topics in molecular immunology. Volume 4, spanning pages 127-155. In this paper, the authors noted that, prior to high-resolution X-ray diffraction, the work of many chemists and physical chemists had only provided a “low-resolution” picture of the “antibody molecule.” Thus, up until this point, the below image, presented within the paper, is what researchers could show as “proof” of the Y-shaped “antibody” particle.
They noted that, in higher resolution X-ray diffraction, the crystallographer is essentially using a high-powered microscope where the lens is replaced by a computer synthesis of the X-ray diffraction data. To achieve this synthesis, it is necessary to obtain information about the amplitudes and phases of the X-ray diffraction maxima (or Bragg reflections). For protein crystals such as “antibodies,” the phases are determined indirectly using the method of multiple isomorphous replacement. The authors pointed out that “the limit of resolution” of this method “is governed by the quality of the crystals, and for proteins, this is usually considerably poorer than for small-molecule crystals.” Protein crystallographers rely on a known sequence of amino acid residues to interpret their often “rather fuzzy maps.” This interpretation is typically achieved by constructing a molecular model scaled to the electron density map and directly superimposable upon it (using techniques like half-silvered mirrors). It was admitted that “the accuracy of the final model will clearly depend on the quality and resolution of the map.” Thus, it can be summarized that X-ray diffraction relies significantly on assumptions about the quality of the crystals and the accuracy of data interpretation to create a model that aims to reflect reality. Interestingly, the authors noted that the picture of the the low-resolution IgG studies favored a T-shaped structure rather than the commonly depicted Y-shaped one.
In their 1977 paper, the researchers performed a reinvestigation of the Dob 6-A electron density map using a systematic computer search for individual domains. They began by selecting a region of the Dob electron density map that they believed might correspond to a particular Ig domain, and the coordinates of the domain were then systematically rotated and translated until they gave the best fit with this electron density. In layman's terms, this was an entirely computational process that involved using an assumed shape of an “antibody” (or a specific part of it) to try and match that shape to the data generated from the electron density map. Essentially, the researchers started with a hypothesis about what the “antibody” looks like and they then rotated and shifted this shape in various ways until it best fit the map's data. The map itself was based on the earlier experiments, but the fitting process involved finding the best match between the assumed shape and the data. In other words, there was no direct observation of the “antibody” itself, and what we ended up with are visual representations based on computational models that were fit to the data in order to create pretty CGI images depicting what has been modeled into the assumed “Y-shape,” which oddly enough, appears as a T as noted by the researchers:
“At present, however, we cannot rule out the possibility that the T-shaped configuration of Dob is merely the result of crystal packing. The protein Kol, which apparently has a normal hinge, has a Y-shaped conformation in the crystal, and a model has been constructed in which there is very little interaction between Fc and Fab.”
Even with this work deemed important enough to highlight by Nature, there is no direct imaging of a purified and isolated Y-shaped “antibody” particle taken directly from the serum. One of the major limitations of X-ray diffraction is that, when used to identify an unknown substance, the sample must be single-phase and homogeneous (i.e., entirely the same). Given the limitations of current purification techniques, it is questionable whether only the assumed “antibody” molecules would be present in the sample used for analysis. If the sample contains a mixture of different materials, X-ray diffraction may not detect components that make up less than 2% of the sample due to its limitations in detecting small or trace components, especially in mixed samples. Therefore, X-ray diffraction cannot be relied upon as the primary method for determining the presence and shape of an unknown substance. Knowing this, it was clear to me that I would need to search outside of the “antibody” timelines in order to find direct images of the elusive Y-shaped particles.
In my search, I eventually came across a paper titled Transmission Electron Microscopy Observation of Antibody that was published in 2012 in the journal Procedia Engineering. In the paper, it is claimed that the researchers had obtained a high-resolution electron microscopy (TEM) observation of an “antibody.” The authors noted that it has been difficult to observe biological matter such as “antibodies” by TEM due to fundamentally weak contrast that must be avoided through the negative staining method. However, even with this method, the resolution of the TEM images has not been enough, and negative staining can make very strong background images and often causes a vaguely outlined image of the object. Thus, the researchers stated that the observation of the biological object must be supported in the vacuum in order to obtain images of these elusive particles. They then claimed that they were able to capture images of an “antibody” standing on the edge of the mica substrate in the vacuum, leading to their success in taking a high-resolution image of an individual “antibody” without background.
The first thing to note about this study is that the images of the “antibody” do not depict purified and isolated substances taken directly from the serum of a host. Instead, the researchers used a synthetic, lab-created monoclonal “antibody” (mAb) known as anti-Hen’s Egg Lysozyme mAb (IgG1). They explained that the “purified” mAb was dialyzed against phosphate-buffered saline (PBS), with the Fab and Fc fragments of IgG1 mAb prepared by digestion with papain, and the F(ab')₂ fragments prepared by digestion with pepsin. This process theoretically involves breaking the “antibody” into smaller pieces, meaning that the final product would no longer be the intact, full-sized “antibody.” Moreover, the fragmentation process may introduce other factors that could affect the functionality or interpretation of experiments involving these fragments. This effectively nullifies the claim of purity, as there is no evidence that only “Y-shaped antibody” particles were present in the sample prior to fragmentation. Additionally, the enzymatic digestion could introduce other molecules or by-products, especially if the digestion is incomplete or if the enzymes (papain or pepsin) are not fully removed afterward. In other words, the fragmented mixture may no longer represent a single uniform product. Regardless, this did not stop the researchers from presenting their two best TEM images which they then claimed was the first time a high-resolution TEM observation has successfully revealed the shape and the numerical size of a single “antibody” molecule in the nanometer scale.
The implication from this paper is that earlier “antibody” images were unable to capture the shape or size of individual “antibody” molecules at such precise resolution. However, considering the various processes used to obtain and interpret these TEM images, it is questionable whether the researchers truly captured “antibodies.” This appears to be another point-and-declare scenario where the imaged particles vaguely resemble a preconceived idea or shape attributed to a hypothetical entity, leading to a claim that such an entity exists. It's important to remember that just because researchers believe they are imaging an “antibody” does not mean that it is, in fact, an “antibody.” As with “viruses,” the methods used to purify, isolate, and prepare samples are either nonexistent, vague, unconfirmed, or destructive to the sample itself. I have yet to come across direct images claiming to show purified and isolated “antibodies” directly from the serum of any human or animal. What we usually find are reconstructions and 3D models based on various methods, each of which has its own limitations, leaving the resulting images open to question.
To further illustrate this last point, I am presenting the entirety of a 2018 paper that I came across in my search that offers valuable insights into the methods used to obtain the images in order to maintain the “antibody” illusion. The paper details the various imaging techniques employed by researchers, while also highlighting the limitations of each method. After reviewing this paper, it should become clear why these images are questionable, especially considering that no mention is made as to how the samples were obtained or whether they were ever purified prior to imaging. It's important to remember while reading that, although particles are imaged and claimed to be “antibodies,” the experimental work proving that these particles are indeed the presumed “antibodies”—rather than artifacts or distortions—and that they function as described, is still missing. The stories about how these particles form and function are largely based on inferences drawn from potentially flawed data, rather than direct evidence. This further underscores the questionable nature of these images and the conclusions drawn from them.
Beginning with the introduction, the authors acknowledge that current technology struggles to ascertain the dynamic structural behavior of “antibodies” and “antibody-antigen” complexes. This admission is critical, as it reveals that researchers face challenges in understanding how these structures change, move, or interact in real time. Proteins, including “antibodies,” are said to exhibit structural variability and heterogeneity, meaning they are flexible and can exist in multiple conformations. The proteins are not uniform, and in the case of “antibodies,” it is claimed that there are over 10 billion types. This inherent variability complicates efforts to capture a complete and accurate picture of these molecules. Such limitations should raise serious questions about the reliability of any claims regarding the exact shape or function of these hypothetical “antibodies.”
IgG Antibody 3D Structures and Dynamics
Antibodies are vital for human health because of their ability to function as nature’s drugs by protecting the body from infection. In recent decades, antibodies have been used as pharmaceutics for targeted therapy in patients with cancer, autoimmune diseases, and cardiovascular diseases. Capturing the dynamic structure of antibodies and characterizing antibody fluctuation is critical for gaining a deeper understanding of their structural characteristics and for improving drug development. Current techniques for studying three-dimensional (3D) structural heterogeneity and variability of proteins have limitations in ascertaining the dynamic structural behavior of antibodies and antibody-antigen complexes. Here, we review current techniques used to study antibody structures with a focus on the recently developed individual-particle electron tomography (IPET) technique. IPET, as a particle-by-particle methodology for 3D structural characterization, has shown advantages in studying structural variety and conformational changes of antibodies, providing direct imaging data for biomolecular engineering to improve development and clinical application of synthetic antibodies.
1. Introduction
Antibodies, or immunoglobulins (Ig), are glycoproteins that make up the humoral portion of the adaptive immune system and fight against pathogens such as viruses, bacteria, parasites, and diseased cells [1]. Antibodies share more than 90% of their identity in their primary sequences; they can be divided into five major classes including IgA, IgD, IgE, IgG, and IgM [2] based on their heavy chains, which differ in physicochemical and serologic properties as well as in their behavior as antigens themselves [3,4]. About 10–20% of proteins in the blood are IgG proteins. Due to their immense variability, plasma antibodies have more than 10 billion types, which can be classified into four subclasses: IgG1, IgG2, IgG3, and IgG4 [5], in the order of decreasing abundance in serum [2]. IgG1, for example, primarily responds to soluble and membrane protein antigens [6].
Antibodies contain two fragment antigen binding arms (Fab) that are formed from an N-terminal heavy chain variable domain (VH) and a light chain variable domain (VL) (Figure 1A). The VH and VL are linked together to form a monomer (H2L2 via inter- or intra-chain disulfide bonds (S-S)) [7,8]. Each heavy chain contains one VH and three to four constant domains (CH1, CH2, and CH3 or Cγ1, Cγ2, and Cγ3). These VH and VL units lie together at the antigen-binding cleft, and the hinge region between CH1 and CH2 allows antibodies (IgGs) to display their flexibility upon antigen binding. The lower hinge region between CH2 and CH3 compose the fragment crystalline domain (Fc), which is responsible for IgG-Fc binding (FcγR, effector function), C1q (complement activation), and the neonatal Fc receptor (FcRn, homeostasis and placental transport, except for IgG2) [9]. Glycosylation of IgG1 mainly occurs on Asn-297 of the CH2 domains [10].
In the next section, the authors highlighted the development of the hybridoma technology by Georges Köhler and Cesar Milstein that was used to create the synthetic monoclonal “antibodies.” This involved fusing cancerous myeloma cells with spleen cells from a mouse “immunized” with sheep red blood cells. The therapies created by these man-made concoctions come with severe side effects such as serum sickness—a dangerous reaction to being poisoned by foreign proteins in antiserum derived from a non-human animal source, resulting in a rash, joint pain, fever, and lymphadenopathy. The authors note that “a key limiting factor in the biopharmaceutical industry is the inability of current methods to characterize the structure of protein-based drugs fully and efficiently with sufficient precision and accuracy.” This is a rather alarming red flag as precise structural characterization is essential for ensuring the efficacy, safety, and consistency of “antibody-based” therapies. This should raise concerns about the accuracy of any claims regarding the exact nature and effectiveness of these protein-based therapeutics. If researchers are unable to properly characterize the “antibodies,” it would be difficult, if not impossible, to completely understand the structure and behavior of “antibodies,” which is essential for ensuring that they function correctly and safely in therapeutic applications. If the “antibodies” were truly purified and isolated, it should be possible to fully characterize them with the existing techniques. By admitting to the limitations of current methods, the authors implicitly acknowledge that purification and isolation processes are insufficient, thus making it impossible to fully and accurately characterize the particles claimed to be “antibodies.”
Monoclonal antibody production has shifted biological and pharmaceutical research as well as clinical therapeutics [11]. In 1975, Köhler and Milstein first used hybridoma technology to develop a mouse monoclonal antibody for combating kidney transplant rejection [12]. So far, more than 60 therapeutic monoclonal antibody products have been approved in the US or Europe, while nearly 100 antibodies are currently being tested in clinical trials [13,14]. First seen with the development of Humira (adalimumab) for treating rheumatoid arthritis, fully humanized antibodies have been generated by assembling lymphocyte V-region genes cloned to display Fab fragments on bacteriophage surfaces [15]. Today, fully humanized antibodies significantly improve the safety and efficacy of monoclonal antibody drug-based therapeutics and diagnostics, including antibody-conjugated drug delivery systems, oncoprotein-targeted cancer therapies, and immunotherapies for cardiovascular, neurodegenerative, and other diseases [16]. In the biopharmaceutical industry, ten of the fifteen top-selling drugs are protein biologics, and of these, five are monoclonal antibodies—the largest class of biotherapeutics—which represent at least 40% of the drugs in development today. A key limiting factor in the biopharmaceutical industry is the inability of current methods to characterize the structure of protein-based drugs fully and efficiently with sufficient precision and accuracy. Thus, we review several major imaging techniques for characterizing antibody structure and dynamics.”
In part 2, the authors discuss various methods used to attempt to characterize the “antibody.” Let's examine each method to see if any provide direct images of purified and isolated Y-shaped particles. The first method discussed is X-ray Crystallography, closely related to X-ray diffraction. This technique involves crystallizing proteins and directing X-rays at the crystal to produce a diffraction pattern, which is then used to create an electron density map. From this, a 3D structure is reconstructed. According to the paper, the images produced by this method are of fragments claimed to be part of “antibodies,” rather than the entire Y-shaped “antibody” in its elusive form. The authors even admit that interpreting the full-length structure of an “antibody” is challenging using this technique.
There are several drawbacks associated with this method, including the requirement for a crystalline sample (proteins are not naturally crystalline), ambiguities in the model due to challenges in visualizing the whole molecule inside the crystal, and the limited resolution of the diffraction data, which can result in unresolved areas or artifacts. Additionally, background noise can introduce inaccuracies, complicating data analysis.
Beyond these issues, the results are not direct images but CGI reconstructions, which the authors acknowledge differ from one another. These reconstructions, therefore, do not represent purified and isolated “antibodies” but are instead interpretations drawn from fragmented data.
2. Methods for Characterizing Basic Antibody Structure
2.1. X-ray Crystallography
X-ray crystallography is a popular method for determining protein structure. In this approach, proteins are isolated, concentrated, and solidarized into crystal form. They are then exposed to an X-ray beam from which diffraction spots are processed as an electron density map to produce a three-dimensional (3D) structure [18]. Although hundreds of antibody structures are available through the Protein Data Bank (PDB), most of them are antibody fragments, typically the Fab arm with a binding pocket. Because of the natural flexibility of antibodies, the full-length structure of an antibody is difficult to determine using X-ray crystallography. To our knowledge, only four structures of IgG antibodies have been determined (PDB entries: 1IGT [19], 1IGY [20], and IHZH [21]). 1IGT is a mouse IGG2 with 3 hinge disulfide (SS) bonds, while human IGG2 has 4 SS bonds. 1HZH is human IgG1 with 2 SS bonds, same as 1IGY, a mouse IgG1. Although full-length IgG4 antibody was also determined by crystal structure, the hinge SS was more stabilized due to the conformational alteration of S228P mutation (PDB entry 5DK3) [14]. Four different conformations show a “Y”-shaped structure, however, the positional orientation and distribution of their Fab domains were different (Figure 1A–D). Considering all structures were determined from the solid state of the protein, their single rigid conformation may be insufficient to show crucial, solution-state dynamic structural features, such as fluctuations and torsions.
Figure 1. Structure and dynamics of antibodies. (A) The crystal structure of mouse IgG2a (PDB entry: 1IGT) shows that an antibody consists of two identical heavy protein chains (blue and red) combined with two identical light chains (green and yellow), which are composed of 7 (for constant domains) to 9 (for variable domains) β-strands (Copyright© Wikipedia). (B,C) However, the crystal structures of mouse IgG1 and human IgG1 (PDB entries: 1IGY and 1HZH) are different, especially for the Fab domains’ location and orientation. (D) The crystal structure of the full-length of the IgG4 antibody was also determined by the crystal structure and the hinge SS was deleted (PDB entry 5DK3). (E) Those structures are also different from the IgG revealed by atomic force microscopy (AFM) (Copyright© 2016 The Royal Society of Chemistry) [17], (F) small-angle X-ray scattering (SAXS), and (G) neutron scattering (Copyright© 2012 Elsevier Ltd.). This variation is also different from that of (H) IgD in solution revealed by SAXS (Copyright© 2005 Elsevier Ltd.) or (I) the structure and fluctuation of IgG1 obtained by negative-staining electron tomography (NS-ET) and individual-particle electron tomography (IPET) 3D reconstructions [16]. Copyright© 2015 the Authors, managed by Nature Publishing Group.
The second method is known as Atomic Force Microscopy (AFM), and it does not rely upon light like regular microscopes. Rather, this method utilizes a tiny, sharp needle that moves across the surface of an object being studied. As the needle moves over the object, it is claimed that the sensors are able to detect the shape and texture of the surface by feeling the forces between the needle and the object. These forces are said to cause the needle to move up and down, creating a 3D image of the object’s surface. It is important to note that these images are reconstructions based upon the movements of the needle as it “feels” the surface of the sample and creates a 3D map. These images are essentially representations created from indirect measurements, and as with any imaging technique, there is a risk of artifacts which may result from an inappropriate tip, suboptimal operating conditions, or even from the sample itself. The authors themselves note that these images insufficiently characterize the 3D structure as they can contain artifacts.
2.2. Atomic Force Microscopy (AFM)
AFM is a tool for imaging the surface topography of macromolecules through moving a sharp tip attached to a soft cantilever [22]. Although AFM allows for the imaging of antibodies and other biomolecules in their native environments, surface topography images insufficiently characterize the 3D structure with images potentially containing artifacts from molecular interaction with the supporting substrate. Using high-speed AFM, the innate fluctuation and dynamic nature of antibodies can be directly observed (Figure 1E) [17,23]. The main advantage of this technology includes the fact that it provides a tool for the quantitative determination of protein at nanometer resolution and the application of forces in the pico-Newton regime, which allows comparing the flexibility between proteins for the mechanical measurement of individual proteins. Moreover, improvements in methodology have allowed for video recording of the real-time dynamics of protein, such as antibodies “walking” on the substrate [23]. High-resolution AFM images of biomolecules and assemblies can reveal sub-molecular details with the ability to observe conformational changes directly, such as the binding of monoclonal antibodies to various partners [23].
Small Angle Scattering (SAS) is yet another indirect method that relies upon the scattering pattern of X-rays. This method utilizes a beam of X-rays (or neutrons) that is directed onto a sample. As the beam hits the sample, the particles inside scatter the light at very small angles. The pattern of this scattered light is measured, and the researchers use this in order to get information about the overall shape and size of the particles within the sample.
The primary drawback of this technique is that its interpretation is model-dependent, meaning researchers must propose a theoretical structure and compare the expected scattering from that structure to the experimental data. As a result, the images produced are reconstructed models based on the scattering pattern and assumptions about the sample’s structure, rather than direct images. These reconstructions are influenced by preconceived notions of the structure, which affects the interpretation of how the particles scatter light. In short, these are not direct images of the elusive “antibodies.” The authors also note that the reconstructed images varied depending on the specific technique used, further highlighting the limitations of this approach.
2.3. Small Angle Scattering (SAS) Method
SAS, which includes small-angle X-ray scattering (SAXS) and small-angle neutron scattering (SANS), is a fast analogous method used to study the structural variety of objects in solutions at resolutions between 1 and 25 nm. Through the scattering curves of the biological sample exposed under X-ray or neutron beams, the experimental curves can be modeled for revealing the average particle size, shape, and surface-to-volume ratio. However, the fluctuation of IgGs revealed by X-ray scattering (Figure 1F) [24] and neutron scattering (Figure 1G) [24] showed a different distribution pattern from that of IgDs revealed by the SAXS technique (Figure 1H) [25] or AFM (Figure 1E) [17]. The study of antibodies in solution showed that the arms of IgGs are highly flexible and have a wide range of Fab–Fab and Fab–Fc angles, and the collective motions of the arms often contribute to the ability of IgGs to bind their antigens.
For Nuclear Magnetic Resonance (NMR) Spectroscopy, it is claimed that by placing a sample in a strong magnetic field and bombarding it with radio waves, certain atomic nuclei within the sample will absorb and then re-emit these waves. By measuring the emitted signals, scientists can infer the arrangement of atoms within the molecule and, from this data, reconstruct a model of its supposed structure.
However, there are significant drawbacks to this method that cast doubt on the accuracy of these models. A key limitation of NMR spectroscopy is its intrinsic insensitivity, meaning it requires high concentrations of a sample to generate usable signals. This presents a challenge for imaging proteins claimed to be “antibodies,” as it has proven difficult, if not impossible, to purify and isolate enough of these particles from the serum in order to produce a clear and accurate image. As a result, the data obtained is most likely incomplete or inaccurate, forcing researchers to rely on indirect inferences about the structure of these particles rather than producing definitive images of isolated “antibodies.”
Additionally, NMR techniques are highly sensitive to motion, and this sensitivity can lead to signal distortions. These distortions often manifest as artifacts in the images, making it difficult to distinguish what could be genuine “antibody” structures from visual distortions. Consequently, the images produced may not accurately represent the particles being studied and could instead reflect artifacts, misleading researchers about the true structure and function of the imaged particles. In the end, as with other methods discussed, NMR does not provide direct images of “antibodies” and is typically viewed as a complementary tool rather than a definitive method for structural determination.
2.4. Nuclear Magnetic Resonance (NMR) Spectroscopy
NMR is an established and popular method for determining structural features for small molecules usually less than 40 kDa, [26] which is much smaller than the full-length of an antibody (usually 160 kDa). Using the 15N-, 13C-, and potentially 2H labeled protein for resonance assignment, this technique can be used to study antibodies in complexes in a weak and transient state to those in a very tight state. Monoclonal antibody formulations in glutamate solutions characterized by Kheddo et al. [27] explored the capability to characterize molecular translational diffusion and aggregation for ideal formulation [28]. However, the technical obstacles, such as attaining optimal solution concentration, close monitoring of the extent of self-association, and the high-level of expertise required for the process, explain why this methodology, which is sensitive to transient interactions between proteins, is viewed as a tool for providing useful complementary information for the formulation of monoclonal antibodies and other therapeutic proteins [29,30].
Transmission Electron Microscopy (TEM) is really the only method listed in the article that could theoretically provide a direct image of the particles claimed to be “antibodies.” In this method, a beam of electrons is passed through a thin sample that has been prepared through different procedures for imaging. As it is said that electrons have much shorter wavelengths than light, TEM reveals details that are much smaller than what can be seen with light microscopes. When used to image proteins, the sample is often frozen in order to preserve its natural structure. It is claimed that the electrons interact with the atoms in the sample, which is recorded in order to produce a 2D image. To create a 3D reconstruction of a protein, multiple 2D images are taken from different angles and combined using computer algorithms to generate a 3D model of the protein. However, it is important to recognize that these models are not direct images but rather a reconstruction based on how the proteins interacted with the electrons.
Additionally, there are several disadvantages to TEM that should challenge the accuracy of the images obtained via this method, especially when dealing with nanoparticles that are unobservable to the naked eye. TEM cannot be used to study live specimens due to the requirement for a vacuum and the high-energy electron beam, which generates significant heat. Sample preparation often involves chemical fixation, dehydration with alcohol, heavy metal staining, embedding in resin, and slicing, which ensures that nothing remains alive in the specimen. As a result, biological interactions cannot be accurately observed, and the harsh preparation and imaging processes may distort the protein's natural shape and introduce imaging artifacts. This means that the particles imaged may not truly represent the structures present in the original sample.
2.5. Transmission Electron Microscopy (TEM) Method for Imaging and 3D Reconstruction of Proteins
TEM can determine the structures of macromolecules and their complexes through 2D projections of objects. Several types of TEM techniques can be distinguished. Based on the sample preparation, the TEM technique can be called negative-staining (NS), positive-staining (PS), cryo-electron microscopy (cryo-EM), cryo-negative-staining (cryo-NS), and cryo-positive staining (cryo-PS). Based on 3D reconstruction methods, TEM approaches can be identified as electron crystallography, single-particle 3D reconstruction (a classification and averaging method), and electron tomography (ET). Recently, a study using the NS and ET technique [31] showed that the spatial distribution of Fab domains is much wider than previous reports (Figure 1I). In the following sections, we will briefly introduce some of these methods.
Negative and Positive-Staining are techniques used to enhance TEM images, but neither provides perfect or highly detailed images. Both methods can affect the natural form of the protein during sample preparation, raising questions about whether the particles being imaged actually exist in the same form in nature. The same drawbacks noted for TEM previously still apply here.
In Negative-Staining (NS) TEM, proteins or small particles are surrounded by a heavy metal stain, like uranyl acetate, which fills the empty spaces around them. When electrons pass through the sample, the stain appears dark while the proteins remain bright, creating a high-contrast image. However, since the stain surrounds the protein, the finer details may not be as precise. Also, the authors noted that NS provides relatively low-resolution images where stain-protein interactions may induce artifacts such as aggregation, flattening, and stacking.
In Positive-Staining (PS) TEM, the stain binds directly to the protein, causing the protein to appear darker in the image. While this technique highlights specific parts of the protein, it can also alter the protein's structure, so the imaged result may not reflect the protein's true form as it exists in nature.
2.6. Negative-Staining (NS) and Positive-Staining (PS) Transmission Electron Microscopy (TEM) for Imaging Proteins
NS and PS are relatively older methods that were first developed by Errera, Welch, and Nuttal in the 1890s to enhance the certain surface features of microorganisms, examined with the aid of the light microscope [32]. In the 1950s, Farrant [33] and Hall [34] first used this method to image biological samples with TEM. By coating molecules with charged heavy metal salts, NS acquired high-contrast imaging of molecules via increased electron scattering by the heavy metal ions around the specimens [35] relative to the electron scattering by the less dense atoms of the proteins [36,37,38,39]. In the PS protocol, heavy metals bind to selective cell constituents to display an increased density of the electron beam on the sample. In PS, the TEM samples need to be washed in distilled water and air-dried to observe the positive density of the proteins [40,41].
In Optimized Negative-Staining (OpNS), as in regular negative-staining, the proteins are still surrounded by a heavy metal stain. The main difference is that the process is supposed to be carefully fine-tuned in order to minimize distortions of the protein's shape as well as improve the contrast of the image. The goal is to try to reduce the amount of damage to the protein and get clearer images with more visible details. However, OpNS still doesn't give a perfect representation of the protein as it exists in nature for various reasons. First, the heavy metal stain can introduce artifacts or false features into the image, making it difficult to accurately interpret the protein’s true structure. Second, the staining process can be uneven, leading to incomplete or skewed representations of the protein’s shape. Lastly, the sample preparation process can introduce variability, meaning that small changes in technique can affect the final image quality.
One of the linked studies in support of this process shows just how skewed the original raw TEM images and details truly are. Take note of how the researchers manipulate contrast and other parameters until they achieve the desired shape for their 3D model.
This raises the concern that what is being presented as “antibodies” may simply be distortions from the TEM process that are selectively emphasized by the researchers. Of note, the authors of the paper admitted that “antibodies” are naturally dynamic, fluctuate frequently, and are structurally heterogeneous. As they are structurally very different and not uniform, the authors admitted that this makes the study of the structure and function difficult using current technologies such as x-ray crystallography, nuclear magnetic resonance (NMR), and even EM single-particle reconstruction because all of these techniques need the average signal from thousands to millions of individual particles in order to get an “accurate” representation.
2.7. Optimized Negative-Staining (OpNS) for Imaging Protein
OpNS offers advantages over traditional NS, which typically provides relatively low-resolution images where stain-protein interactions may induce artifacts such as aggregation, flattening, and stacking [42,43,44]. For example in lipoproteins [35,45,46,47,48,49,50,51,52], a common artifact produced is rouleaux, where lipoprotein particles are stacked and packed together into a string [53,54,55,56,57,58]. To overcome these obstacles by reducing artifact formation and increasing resolution, an optimized negative-staining (OpNS) protocol has been developed [51,52,59,60,61,62,63,64,65,66,67,68,69]. In these studies, a specific type of staining reagent (such as Uranyl formate, UF) and relatively low salt concentration were identified as key parameters for avoiding rouleaux artifact formation, while the light-exposure prevention and small filtering (0.02 μm) methods were found as key parameters in obtaining high-resolution images of small and asymmetric proteins [31,52]. OpNS methodology has been used to examine several structure-known proteins such as cholesteryl ester transfer protein (CETP) [59], antibodies [31,60,61,62], GroEL and Protesome [63], and to determine the structure of unknown proteins, such as Contactin-associated Protein-like 2 (CNTNAP2) [64], Calsyntenin-3 [65], 84-base pair dsDNA conjugated with 5 nm nanogold [66], DNA origami [67], liposome-CETP complex [68], and lipoproteins and their forms when bound to an antibody [52,69,70,71]. The success in imaging these small proteins (40–200 kDa) provides evidence that the OpNS method is a useful tool to push the conventional EM boundary toward determining small and asymmetric protein structures, including antibodies (Figure 2).
Figure 2. The Optimized Negative Staining (OpNS) Electron Microscopy (EM) images of IgG2 antibody particles. (A) Survey view of the IgG antibody particles imaged by OpNS EM. (B) Representative images of individual particles of antibody. (C) Zoomed-in views of selected individual particle images and (D) their corresponding denoised images are compared to (E) the crystal structure at a specific orientation. Copyright© 2015 the Authors, managed by Nature Publishing Group.
Cryo-Electron Microscopy (cryo-EM) is a technique that is used to image proteins and other biological molecules at a very high resolution by freezing the sample. The proteins are suspended in a thin layer of liquid and then rapidly frozen, which is said to help preserve the natural structure without the need for staining or other treatments that might alter them, as observed in the other methods. Once the sample is frozen, a beam of electrons is passed through the sample in order to capture images of the proteins, which are typically taken from different angles and then combined using computer algorithms to create a 3D model.
It is important to note that the images produced are not direct images and are still a 3D model reconstruction. Several factors can affect the accuracy of the final representation, such as ice crystal formation during freezing, electron beam exposure causing bubbling, ice contamination and damage to the samples, and potential bias in the computer modeling process. Other issues include the ineffectiveness of Cryo-EM for imaging very small proteins as well as the requirement of very high sample homogeneity, which increases the difficulties of obtaining high-resolution images of flexible proteins such as “antibodies.”
2.8. Cryo-Electron Microscopy (cryo-EM) for Imaging Protein
Winning the Nobel Prize in Chemistry in 2017 [72], James Dubochet developed Cryo-EM which is an established and increasingly popular method used to analyze large molecules and molecule complexes (usually > ~100 kDa) at atomic resolution [73]. James Dubochet developed the cryo-EM method where buffer-based samples are rapidly frozen with a bath of liquid ethane cooled by liquid nitrogen. As a result, the molecules of water with supporting carbon films cannot form a crystalline lattice before being frozen into the amorphous form of an ice crystal, allowing the biomolecules in the sample to be retained in their native conformation [74]. A complementary advantage of cryo-EM, as compared to X-ray crystallography, is that cryo-EM allows for thousands of flash-frozen images of proteins that cannot be easily formed into large crystals. Recently developed high frame rate image detectors, such as the Gatan K2 direct detector camera, can provide a 10× higher frame rate than that of conventional cameras [75]. The high frame rate allows for tracking and correcting the drift of the cryo-EM images and increases the efficiency of signal-detecting to improve both the image contrast and resolution for large molecules [76].
Cryo-Negative Staining (cryo-NS) and Cryo-Positive Staining (cryo-PS) are variations of the negative and positive-staining techniques used in TEM imaging. In cryo-NS, just as in regular negative-staining, the protein sample is mixed with a heavy metal stain to create contrast. The key difference here is that the sample is rapidly frozen to preserve its structure. However, even with the added freezing step, the heavy metal stain can still cause distortions or introduce artifacts, which affect the accuracy of the final image.
For cryo-PS, the stain binds directly to the protein, making it appear darker in the image, and the sample is also quickly frozen to help maintain its natural structure. Despite this, there remains a risk of altering the protein’s structure due to the stain, meaning that the accuracy of the image can still be compromised. While the freezing process is said to help preserve the protein's structure more effectively than regular staining methods, both cryo-NS and cryo-PS can still introduce artifacts or distortions. As a result, the imperfect images and biased models produced may not fully represent how the proteins exist in nature. The authors point out that a major challenge with these methods is that they can permanently eliminate structural information, making it challenging to image small proteins such as “antibodies” using these methods. They state that an alternative method needs to be developed for the study of small proteins.
2.9. Cryo-Negative-Staining (cryo-NS) and Cryo-Positive Staining (cryo-PS) for Imaging Protein
Cryo-NS and cryo-PS aid in enhancing the low contrast images of unstained biological particles imaged by traditional cryo-EM, especially for small proteins (<100 kDa). High defocus (typically several μm) is usually used to partially enhance the particle contrast, although this eliminates a certain percentage of structural information. Briefly, under higher defocus, the oscillation of the amplitude crosses zero more frequently and, as a result, the convolution between the contrast transfer function (CTF) and structure would cause an increased percentage of structural information to be permanently eliminated, limiting the imaging for small proteins. As a result, small proteins are challenging to study using this condition.
An alternative approach for imaging is largely needed to determine the structure of small proteins. Adrian et al. proposed an approach combining negative staining with cryo-EM, termed cryo-negative staining (cryo-NS), to overcome the low contrast under closer focus conditions [77]. In this method, the cryo-EM grid is washed quickly with a solution of 16% ammonium molybdate before rapidly freezing into a bath of liquid ethane. The cryo-NS images showed fine structural detail and the overall particle shape was consistent with the unstained cryo-EM image, supporting the advantages of the method.
As an alternative approach to cryo-NS, cryo-positive staining (cryo-PS) was reported by Zhang et al. for directly imaging the high-resolution structure of proteins imaged under near focus conditions [51,52]. For example, the high-resolution cryo-PS images of 53 kDa CETP contain remarkable secondary structural details of an individual molecule (Figure 3B) [6,59]. The cryo-PS method was developed by combining OpNS with conventional cryo-EM protocols. Instead of 16% ammonium molybdate, 1% Uranyl formate (UF) was used as a staining reagent. Since the cryo-PS image showed a reversed image contrast to that from the cryo-NS protocol and consistent contrast with that of the conventional cryo-EM image, it was named cryo-PS. The high-resolution cryo-PS images suggested that UF penetrates the molecular surface, which challenges the conventional understanding that staining can only occur on the outer surface of the protein. The mechanism of UF penetrating the molecular surface is unknown. One possibility is that the Uranyl cation binds to available protein carboxyl groups to enhance the electron scattering which is similar to the multiple isomorphous replacement (MIR) method in X-ray crystallography [78,79,80]. The cryo-PS protocol is a suitable backup method for cryo-ET and can be applied to study an individual macromolecule in solution, such as DNA origami [67].
Figure 3. The artifacts shown in the averaged 2D images and 3D reconstructions of flexible antibody particles. (A) The fuzzy domains indicated by arrows in the selected reference-free 2D class averages of antibody images (a total of 11,373 particles). Bars: 100 Å. (B) The initial model bias and artifacts in the single particle 3D reconstructions of IgG antibody. The initial models of antibodies with three globular domains showed their bias in positions of the domains in the final 3D reconstruction. (C) While using Gaussian ellipsoids as bias-free initial models, the final 3D images showed incorrect structures by (D) comparing to the crystal structure. Copyright© 2015 the Authors managed by Nature Publishing Group. (E) A similar blurred 2D average also was apparent in the dual-variable-domain IgG molecules. (F–H) The single-particle 3D reconstruction (averaged particles) showed that the Fc domain was eliminated. Copyright© 2013 Landes Bioscience. (I) The averages of a hundred subvolumes of 3D reconstructions of antibody particles can also eliminate the domains. Copyright© 2015 the Authors managed by Nature Publishing Group.
Electron Crystallography is yet another method used for determining the 3D structure of proteins, and it does so by analyzing how electrons interact with a crystalline sample. With this technique, proteins are claimed to be arranged into a regular, repeating crystal lattice, and a beam of electrons is passed through the crystal that scatters and creates a diffraction pattern that is recorded. This is similar to what was described in both the X-ray crystallography and diffraction methods from before. Using various computer algorithms, the recorded diffraction patterns from different angles are combined to reconstruct a 3D model of the protein's structure.
There are several limitations to this process that challenge the accuracy of the images and models produced. There is a requirement of the protein to form well-ordered crystals, and distortions can arise during the crystallization process. In addition, high energy eelectrons can cause radiation damage to 2D samples, which can lead to the creation of artifacts or distortions from the interactions with the electron beam, affecting the accuracy of the final 3D model. As with the other methods, the final 3D model is still a reconstruction that is based upon indirect measurements and may not perfectly represent the protein’s true structure as it exists in nature.
2.10. Electron Crystallography for 3D Reconstruction of Protein
Electron crystallography is the first TEM technique that has been used to determine the atomic resolution structure of proteins, especially membrane proteins embedded in lipid bilayer [81,82]. This technique requires that proteins are oriented into 2D array. Through the merging of their electron diffractions and projection images acquired from different tilting angles, the atomic resolution structure of proteins can be determined. The limitation of this approach is similar to X-ray crystallography, in which adequate crystallization of proteins is required.
Single-Particle 3D Reconstruction for Averaging 3D Structure is a method where proteins are placed onto a surface, and a series of images from different angles are taken using an electron microscope. In order for this method to work, the sample must be homogeneous (i.e. consisting of identical particles). However, since proteins can vary in shape, orientation, and natural flexibility, each image may look different. Thus, thousands to tens of thousands of particle images must be analyzed and aligned to average out these differences in order to create a consistent 3D model.
A key disadvantage of this method is that it cannot be used to determine new or novel structures. For example, verifying the Y-shaped structure of “antibodies” would require prior purification and isolation of these particles. The authors acknowledge that there are no definitive criteria to confirm that the particles share the same structure before averaging and classification. This method relies on assumptions, such as differences between particles being due to random noise or variations in orientation, and that the particles have one or few distinguishable identical conformations. These assumptions can introduce bias into the modeling process. As a result, the final 3D model is a computer-assisted reconstruction and may not fully represent the protein’s true structure as it exists in nature.
2.11. Single-Particle 3D Reconstruction for Averaging 3D Structure of Protein
Along with cryo-EM, single-particle 3D reconstruction for averaging the 3D structure of a protein was also a subject of the 2017 Nobel Prize in Chemistry and has been rapidly developed and used for protein structure determination at the atomic resolution over the past two decades. Although it was named “single-particle”, the 3D structure obtained is not from a single or an individual particle but averaged from thousands to tens of thousands of different particles. The advantage of the single-particle 3D reconstruction is to determine the molecular structure without prior requirement of crystallization. Therefore, the structure is more likely to be in its native state, instead of the solid state used for X-ray crystallography. Recent advances in direct detector technology for acquiring high-contrast images [75] and improvement of computer software algorithms [81,82] for precise classification and averaging now allow for the determination of the protein structures at atomic resolution [72]. The method has been also used for antibody 3D structure study [83,84]. The disadvantages of the method include (i) the sample needs to be relatively homogenous; (ii) particles were assumed to share one or few distinguishable identical conformations; (iii) 3D reconstruction depends on the initial model [85], such as that shown in (Figure 3B) [60]; (iv) the natural dynamics of protein can be mischaracterized [76]; (v) 2D projections/images are insensitive and insufficient to use to distinguish the conformation in 3D, such as the right-hand and left-hand objects [31]; (vi) no criteria can be used to confidently judge if the particles shared the same structure before averaging and classification; vii) potential artifacts can be produced in the 3D reconstruction of the flexible portion (Figure 3A,E) [30]; (viii) unexpectedly small dimensions are difficult to characterize (Figure 3F–H) [30]; (ix) certain domains can be eliminated (Figure 3H) [84]; or (x) resolutions can be of uneven distribution [83,84]. The absent domains/regions can even be shown in a near-atomic resolution single-particle 3D reconstruction, such as the ankyrin regions which disappeared in the atomic structure of TRPV1 [76].
Single-Particle Electron Tomography (ET) is a method where a sample containing proteins is imaged using an electron microscope from multiple angles by incrementally tilting it. This process creates a series of 2D images, which are then combined using specialized software to reconstruct a 3D model of the protein.
However, like other imaging techniques, ET has its limitations. Variability in protein orientation, noise, and other factors can affect the quality of the final 3D model. The heterogeneity of the sample, which is common in those said to contain “antibodies,” can lead to disruption by significant noise, missing wedge artifacts, and the introduction of systematic reconstruction errors that all affect the accuracy of the alignment and classification of the subvolumes. The errors in the classification and alignment can further influence the quality and inaccuracy of the 3D averaging. Furthermore, classifying particles into a limited number of groups is accomplished through human decision, which the authors note introduces subjectivity and bias that limits the objective understanding of the natural dynamics and equilibrium state of proteins in solution. As a result, the final model still represents a computer-assisted reconstruction rather than a direct image of the protein that may not reflect the natural state of what is imaged.
2.12. Single-Particle Electron Tomography (ET) for Subvolume, Averaged 3D Structure of Proteins
Electron tomography (ET) is a method that has been used to study the structure of a single-instance large object, such as the section of a cell or bacteria, by producing an image from a series of viewing angles [86,87]. The 3D density map was reconstructed from these tilted images by a computer algorithm. The resolution of ET 3D reconstruction was believed to be too low to be used for the characterization of protein structure and dynamics [88]. To improve the 3D reconstruction resolution, a detour solution was proposed, in which hundreds to thousands of subvolumes that contained a single protein particle were aligned and averaged into a single 3D density map [89]. This approach showed its utility for imaging proteins that are structurally homogeneous with symmetry [88,90], including GroEL [91]. The subvolume averages can reduce the 3D noise and fill the missing wedge artifact to achieve near atomic resolution for the 3D reconstruction [92]. However, for proteins with substantial asymmetric and structural heterogeneity, the accuracy of the alignment and classification of those subvolumes can be disrupted by significant noise, missing wedge artifact, and the introduction of systematic reconstruction errors [89]. The errors in the classification and alignment can further influence the quality of the 3D averaging [31]. Moreover, for a continually changing structure, classifying particles into a limited number of groups is accomplished through human decision, which introduces subjectivity and bias that limits the objective understanding of the natural dynamics and equilibrium state of proteins in solution. For example, an averaged 3D map from a hundred subvolumes of 3D reconstructions of antibody particles would contain artifacts, such as shrinking the size of the Fab domains (Figure 3I) [60].
Individual-Particle Electron Tomography (IPET) is the main method focused on by the authors of this paper. It is a variation of electron tomography that attempts to reconstruct 3D structures of single molecules at a high resolution. In this method, it is claimed that a single protein molecule is imaged using an electron microscope from multiple angles in order to try and capture different perspectives. Just as before, the various 2D images are aligned and combined using a 3D reconstruction computer algorithm, known as focused electron tomography reconstruction (FETR), to produce a 3D model of the protein.
However, as has been discussed with other electron microscopy techniques, IPET has its limitations. The same major issue applies in that the protein's natural structure can be affected by the imaging and sample preparation processes, such as freezing or staining, as these processes can introduce artifacts or distortions. Additionally, as noted earlier, proteins such as “antibodies” are said to be flexible and can exist in various conformations, making it difficult to accurately reconstruct a single, definitive structure. Noise and other variables, such as incomplete data due to missing wedge artifacts, can further distort the 3D reconstructions. Ultimately, the final 3D model is still a computer-assisted reconstruction rather than a direct representation of the presumed “antibody” as it exists in its natural environment. This leaves room for inaccuracies and assumptions in the final model.
2.13. Individual-Particle Electron Tomography (IPET) for Single Molecule 3D Protein Structure
IPET is an experimental approach that can determine the 3D structure of an individual particle at nanometer resolution, opening the possibility to reveal the true, more accurate dynamic nature and fluctuations of molecules in solution (Figure 4) [6,8,18,34,60]. Comparing to conventional single-particle 3D reconstruction, IPET is the real single-particle 3D reconstruction that does not require a pre-established model, nor averaging from multiple molecules. In contrast, the traditional “single-particle” 3D reconstruction requires an initial model and/or averaging from hundreds to thousands of particles for obtaining a single averaged reconstruction. Moreover, IPET can tolerate the small tilt-errors or large-scale image distortions that often accompany the intermediate-resolution (1–5 nm) of single structural “snapshots” of molecules [31]. IPET improves the quality of the 3D reconstruction via several technical improvements by modifying the protocol for sample preparation (including OpNS [51,63]), methods for controlling data acquisition [93], the 3D reconstruction algorithm [31], and corrections for missing wedge. To avoid the influence of image distortion and tilt angle errors, the reconstruction algorithm (called focused electron tomography reconstruction (FETR)) reduces the reconstruction size for precisely aligning the tilt images under sets of dynamic filters and soft-boundary masks through local refinement iteration [31]. IPET has been used to study flexible proteins embedded in both vitrified ice (cryo-electron microscopy, cryo-EM) and heavy metal ions (negative-staining, NS). IPET 3D reconstructions from cryo-ET include 17 nm nascent HDL particles [31], 53 kDa CETP bound to liposome [68], DNA origami [67], and very low-density lipoproteins with their antibody binding complexes [69] in the resolution range from 3 to 10 nm. IPET 3D reconstructions were successfully obtained from high-contrast OpNS images, including 53 kDa CETP, 150 kDa IgG1 particles [31,60,61], peptide-antibody conjugates [61], an 84-base pair dsDNA bound to 5 nm nanogold particle [66], 88 kDa Calsyntenin-3 (C3) monomer [65], a 350 kDa C3 oligomer [65], 135 kDa Contactin-associated Protein-like 2 (CNTNAP2) [64], CNTNAP2 and 1.8 nm nanogold conjugates [64], CNTNAP2 and 5 nm nanogold conjugates [64], CNTNAP2-antibody complex [64], and a 60 kDa N-terminal domain of CNTNAP2 [64], in which the resolution can be improved up to 1.2 nm.
Figure 4. A 3D image of an individual particle of IgG1 antibody reconstructed by individual-particle electron tomography (IPET). (A) Schematics of the ET imaging of an individual particle of protein from a series of tilt angles. (B) The step-by-step process of the IPET 3D structure of an individual particle of IgG1. (C) The final IPET 3D reconstruction. (D) Docking the structural model by using molecular dynamics simulation. (E) The final IPET 3D reconstruction of a defined conformation of IgG1. Copyright© 2015 the Authors managed by Nature Publishing Group.
Although the IPET 3D has not been able to provide secondary structural features, it is still sufficient in allowing flexible docking of the crystal structure into IPET 3D by MD simulation under the chemical bond constraint and energy minimization conditions (Figure 4D,E). The structures revealed from this combined approach could answer some important biological questions, such as conformational changes of IgG1 domains induced by peptide conjugation [61]. IPET provides an exciting new opportunity for studying heterogeneous protein structures, dynamic characteristics (Figure 5), and equilibrium fluctuation by tracking chemical conformational changes and behaviors [71]. A review by Ericus et al. [94] has outlined the difficulties and solutions for EM regarding both hard and soft materials research for 3D reconstruction and visualization of sub-nanometer structures. In addition, it is reported that many methods can be utilized to overcome sample-based limitations in both physical and biological sciences with the motivation to innovate and advance large-scale solutions in a cooperative manner.
Figure 5. The IgG1 structural dynamics by individual-particle electron tomography (IPET). (A) 120 IPET 3D reconstructions from each individual particle of IgG1 and their docked structural models by using molecular dynamics simulation. (B) The overlap of 120 structural models revealed by 120 individual molecules, showing the difference in the structures. (C) Statistical analysis of the domain angle and distance distributions. Copyright© 2015 the Authors managed by Nature Publishing Group.
Part 3 primarily focuses on promoting IPET as an experimental method to “accurately” image and reconstruct an “antibody.” However, as with the previous examples in this paper, there is no mention of how the supposed “antibodies” were obtained or whether any purification and isolation directly from the serum was attempted prior to imaging. Instead, the researchers appear to be selecting particles that could easily be artifacts or distortions, and from there, constructing narratives about the structure and function based upon the 3D reconstructions.
3. Applications of IPET 3D Reconstruction Approach on Antibody Studying
3.1. 3D Structure Variety of IgG1 Antibody by IPET
Although other methods have provided invaluable structural data for antibodies and antibody-antigen complexes, IPET can visualize a single molecule in 3D at various conformations to provide more substantial evidence for the better characterization of antibody dynamics. Studies by Zhang et al. [60] better described the IgG1 flexibility and fluctuation using IPET reconstruction from OpNS ET images to obtain 3D density maps of a single protein at intermediate resolutions (1–3 nm) (Figure 4); thus, validating the applicability of the approach for understanding protein behavior and function. Such studies show that the combination of IPET and OpNS can expand the experimental approaches to the antibody structural dynamic nature of IgG1 (Figure 5) [60]. Other studies have highlighted the applicability of IPET 3D characterization of particle-particle interaction in vitreous ice, such as antibodies bound to human plasma very low-density lipoproteins (VLDL) (Figure 6) [69], and cholesteryl ester transfer protein (CETP) to liposome [68]. In the field of lipid research, cryo-EM has determined the polyhedral 3D structure of hydrogenous VLDL particles via IPET and has characterized the directional binding of cholesteryl ester transfer protein (CETP) to HDL and VLDL to improve the understanding of the role of VLDL in atherogenesis [69]. Such studies underscore the practicality of TEM alongside IPET to promote the understanding of dynamic antibody interaction [69].
Figure 6. The IPET 3D structure of IgG1 bound to antigen in vitreous ice. (A) Cryo-ET images of IgG mixed with very-low-density lipoprotein (VLDL) particles. (B–I) IPET 3D reconstruction of two complexes of antibody bound to VLDL. The sample is embedded in vitreous ice. (J,K) Six presentative IPET 3D maps from six individual antibody-VLDL complexes (antibodies’ location were indicated in purple color). Copyright© 2016 by the American Society for Biochemistry and Molecular Biology, Inc.
The dynamics of IgGs depend on the hinge length, hinge SS patterns in between isotypes, and the conjugation and antigen binding for the same isotype. The numbers of disulfide bonds located between the hinge and the heavy chain regions are 2 for human IgG1 and IgG2, 4 for IgG4, and 11 for IgG3, although they each contain a total of 12 intra-chain disulfide bonds. Each disulfide bond is associated with an individual IgG domain; therefore, IgG3 has less flexibility for the formation of disulfide bond variants due to its higher number disulfide bonds. IgG4 also has non-classical disulfide bond structures. IgG1 has two proline residues and IgG4 contains one proline residue, which is unstable. The instability of the inter-heavy chain disulfide bonds of IgG4 allows it to be bispecific in vitro. The number of disulfide bonds and residues thus affects the flexibility of a hinge region and may affect the possible conformations of the Fab arms and Fc domains. The number of amino acids in hinge regions of IgGs is variable: 15 in IgG1, 12 in IgG2, 62 in IgG3, and 12 in IgG4. Although the hinge regions of both IgG2 and IgG4 contain 12 amino acids, the polyproline helix makes the IgG2 hinge even more rigid. In IgG3, the Fab fragments are relatively far from the Fc fragment, yielding greater flexibility. The flexibility of Fab arms relative to Fc domains varies between subclasses (IgG3 > IgG1 > IgG4 > IgG2) and this flexibility affects the antigen binding capacity and immune complex formation. It is also important to note that much of the limited literature on the functional characterization of structural dynamics and antibody stability of varying immunoglobulin isoforms comes from mutagenesis studies that have examined the effects of selective mutations of specific hinge-region residues through observation of the subsequent changes in antibody flexibility, stability, and binding, with disulfide patterns and hinge length being factors that potentially affect the dynamic nature of different human IgGs.
Current understanding of antibody structural dynamics is rooted in several methods. Emphasized in this review, various TEM imaging techniques can be used to obtain the IgG dynamics. For example, directly measuring the angle of Fab-Fc-Fab from the acquired 2D images, as showed in the Figure 7H [61], mapping a 3D structure from the 2D image of each antibody for angle destitution analysis [83] and 3D reconstruction from each individual antibody for analysis is shown in Figure 5C [60]. Both the 2D and 3D analyses showed the same peak population of the antibody, while the 3D analysis shows a closer to Gaussian distribution and the 2D analysis showed a higher percentage of angles above the peak angle. Moreover, the role of antigen binding showed changes in the structure and dynamics of bound IGGs as showed in above VLDL-antibody complex [69] and below peptide antibody conjugates [29]. A detailed discussion was recently published by Chen et al. [83].
Figure 7. The peptide conjugated IgG1 structural dynamics and conformational changes in IPET. (A) The schematics of peptide conjugating with the IgG1 antibody. (B) The survey view of peptide conjugating IgG1. (C) The selected particles of IgG1 prepared by OpNS method. (D) Measuring the domain size and shape. The left is unconjugated, the right is conjugated. (E,F) Histograms of the domain size and shape. (G) Measuring the angle between two Fab domains, (H) the histogram of the angles. Copyright© 2013 the Authors managed by Nature Publishing Group.
Characterization methods have been reported that use reduction, differential alkylation, liquid chromatography, and mass spectroscopy analyses to characterize the ranking order of disulfide bond susceptibility in recombinant antibodies. Modification of amino acids in the hinge region of IgG4 has been shown to produce structural alteration. Scapin et al. reported the therapeutic pembrolizumab structure, a human full-length IgG4 S228P anti-PD1 antibody at the 2.3-Å resolution [14]. They proposed that a shortened hinge region of pembrolizumab results in a new conformation by preventing the IgG4 arm exchange. Throughout the remainder of this review, we highlight the available imaging techniques that can be used to directly visualize antibody structures and better characterize dynamic conformational behaviors.
In this next section, the authors acknowledge that most imaging methods have limitations when it comes to clearly identifying 3D structural changes after conjugation. They also admit that the current IPET method is inadequate for providing high-resolution structures and for detecting conformational changes in the complementarity-determining regions (CDRs) in response to antigen binding. It is important to note that these "limitations" are based on the researchers' assumptions about what they believe they should be able to “see.” The particles themselves, along with the processes attributed to them, are entirely unobservable and require extensive manipulation to even “visualize.” The narratives constructed from these indirect methods and measurements may have no grounding in reality, as they fail to truly reflect nature.
3.2. 3D Structure and Conformational Changes of Antibody Drug Conjugates (ADCs) by IPET
The rationale for using ADCs in pharmacology is explained by the ability to use the pharmacokinetics of an antibody to deliver an attached drug more efficiently [95]. The tagged antibody conjugates can be used for assessing drug effectiveness by quantifying their uptake into cells [96,97]. However, few papers highlight the nanometer-scale structural dynamics of ADCs due to the limitations of most imaging methods to clearly identify 3D structural changes after conjugation. The combined methods of IPET and OpNS, however, continue to provide evidence for visualizing and characterizing structural behaviors of ADCs.
A study by Tong et al. [61] used a modified peptide covalently linked to the complementary-determining region (CDR) loop on humanized h38C2 IgG1 (conjugated antibody: CovX-body by Pfizer CovX LLC) as a model to view images of conformational changes that occur because of conjugation (Figure 7). The OpNS protocols were used to obtain high-resolution images of the peptide-conjugated IgG1 compared to unconjugated IgG1 [71]. The domain size, shape, and fluctuations of conjugated- and unconjugated-IgG1 were quantitatively and statistically analyzed (Figure 7). Although the domain sizes remained constant, the images showed significant changes in the domain shape and fluctuations in the conjugated antibody. They found that the Fab1 − Fc − Fab2 angles became narrower in the conjugated IgG1, as compared to the unconjugated IgG1, indicating that the space between the Fab regions likely became restricted because of peptide conjugation (Figure 7). This constriction may interfere with Fab binding to the antigen, which could also interfere with the Fc fragment binding to FCγII or FcRn.
The IPET approach was then used with the FETR algorithm to convert OpNS 2D images into reconstructed 3D models for each individual particle (Figure 8). The Fab1 − Fc − Fab2 domains of conjugated IgG1 showed an elongated, rod-like shape compared to unconjugated IgG1, leading to a more rigid and stiff structure. This indicates that the mechanism of peptide-induced conformational change is either due to the steric effects to compensate for both alpha helices of the peptide by reorienting the Fab and Fc domains or due to the intertwining β-sheets of the Fab region to trigger Fc domain alterations. This “trigger model” provides an explanation for the loss of the effector function in antibody-dependent cellular cytotoxicity (ADCC) (Figure 8) [95]. The conjugation-induced structural alterations likely caused changes in pharmacokinetics, making antibody clearance and removal physically challenging. Interestingly, the IPET protocol allows for a higher resolution image and more accurate angle measurements than the 2D images and further enhances the capability to monitor dynamic interactions of antibodies after drug delivery and facilitates more effective, efficient, and specific drug targeting (Figure 8). However, the current method is insufficient in providing any high-resolution structures and conformational changes regarding the complementarity-determining regions (CDRs) in response to antigen binding.
Figure 8. The IPET 3D maps of IgG1 and peptide conjugation. (A) The process of IPET 3D reconstruction of an individual particle of peptide conjugated antibody particle, (B) final IPET 3D density map, (C) and docked structural model using molecular dynamics simulation. (D) The process of another IPET 3D reconstruction, (E) its final IPET 3D density map, and (F) the docked model. (Copyright© 2015 the Authors, managed by Nature Publishing Group) (G) Two representative conformations of two unconjugated antibody particles. (H) Two representative conformations of two peptide conjugated antibody particles. (I) Schematics of the mechanism of the conformational changing induced by peptide conjugation.
The images presented here are, once again, 3D reconstructions based upon what may be artifacts or distortions. The authors show how the original image is “denoised” and then superimposed with the model. Interestingly, one example of the 2D IPET 3D reconstruction is of an individual “antibody” that is X-shaped. Apparently, “antibodies” present themselves as various letters in the alphabet.
3.3. Bispecific Antibody Structure Variety by IPET
Because bispecific antibodies can simultaneously recognize two different targets, they are poised to revolutionize biotherapeutics through improved characterization and engineering. Unlike conventional monoclonal antibodies, knob-into-hole bispecific antibodies are subject to increased variant possibilities such as homodimerization in covalent and noncovalent forms. Recently, Zhang et al. [62] addressed a unique challenge of bispecific antibody production and characterization using the combination of EM and mass spectrum approaches to analyze storage- and pH-sensitive hydrophobic interaction chromatography (HIC) profile changes for a hole-to-hole homodimer bispecific antibody (Figure 9A,B). Compared to this unstable hole-hole homodimer Fc under different storage conditions, a bispecific heterodimer, characterized with the same methods and guided by knob-into-hole assembly, displayed stable conformation with homogeneous distribution, confirming its desired therapeutic quality while providing a better understanding of the homodimer and heterodimer variants. With advancements in the feasibility and accessibility of EM through methods such as OpNS and IPET 3Ds (Figure 9C), there is great potential to apply these high-throughput methods on a larger scale to accelerate research for the production of needed therapeutics.
Figure 9. The IPET 2D and 3D images of IgG hole-hole homodimer (A) Two representatives of raw images of two Y-shaped antibodies and two representatives of reference-class averages of Y-shaped antibodies. (B) Two representatives of raw images of two X-shaped antibodies and two representatives of reference-class averages of X-shaped antibodies. Top to bottom, the rows show the original image, their denoised image, superimposed with the model, and the model. Copyright© 2017 American Chemical Society. (C) One example of 2D IPET 3D reconstruction of an individual-particle of X-shaped antibody. The order is raw image, projection of raw 3D, projection of final 3D, final IPET 3D, and docked model.
The authors conclude that IPET offers promising evidence as the leading method for determining the structural dynamics of particles identified as “antibodies.” They acknowledge the limitations of previous methods, such as X-ray crystallography's challenges with sample crystallization, NMR spectroscopy's difficulty in visualizing large molecules, NS EM's potential for generating artifacts, cryo-EM's struggles with imaging small proteins (<100 kDa) due to noise and modeling bias, and AFM's risk of surface artifacts from sample-substrate interactions. Despite its low-resolution output, they claim that IPET is currently the only experimental approach capable of achieving a 3D image from a single small molecule.
However, despite the claims of IPET being a promising technique, it still faces significant challenges that hinder its potential. The low-resolution images produced are highly open to interpretation, and the reliance on computer-assisted reconstruction introduces biases into the 3D modeling. Additionally, the assumption that the imaged particles are indeed “antibodies,” without clear evidence of purification or isolation as well as experimental results demonstrating function, raises serious doubts about the validity of the findings. The interpretation of these images often relies on preconceived notions about the particles’ structure and function, rather than direct observation, which calls into question the accuracy and reliability of the final models. Thus, while the authors argue that IPET offers a novel approach, it remains far from a definitive method for studying complex particles and making conclusive statements about their identity and function.
4. Future
IPET has shown to be a powerful tool for the 3D imaging of a single protein, such as an antibody, and it offers promising evidence as a leading method for determining structural dynamics at a resolution near 1 nm. Although the other techniques and methods discussed here have shown their utility in characterizing antibody structure and antibody-antigen complex structure, distinct disadvantages remain that hinder their advancements. X-ray crystallography is limited by difficulties with sample crystallization, NMR spectroscopy presents difficulty visualizing large molecules, NS EM generates potential artifacts, cryo-EM presents difficulty imaging small proteins (<100 kDa) due to noise and potential 3D modeling bias, and AFM potentially produces surface artifacts from sample-substrate interactions. Despite the low resolution 3D images, IPET is the only known experimental approach for achieving a 3D image from a single small molecule, providing the capability to better characterize molecular conformational dynamics. These point to exciting possibilities for comprehensive antibody and antibody-antigen complex imaging for the advancement in applied molecular biology, immunology, and pharmacology. Importantly, IPET allows for the examination of samples at their near-native buffer state (such as, while embedded in vitreous ice) with an improved resolution without the need of coating with a heavy metal, often used in the NS approach. With better characterization of antibody dynamics and structural behavior, this technique, alongside other imaging methods, can be used to engineer more targeted approaches for the development of antibody therapeutics while improving efficiency and sustainability in addressing the continual, expanding need of treatment options for various diseases.
https://www.mdpi.com/2073-4468/7/2/18/htm#B31-antibodies-07-00018

What became clear from my investigation attempting to find the earliest images of purified and isolated Y-shaped “antibodies” taken directly from serum is that such an endeavor is nearly impossible. Instead, what I discovered were schematics and representations of what these particles were proposed to look like, developed over many decades through inference from indirect methods. The TEM images I found from the 2010s were either extremely vague snapshots of particles claimed to be monoclonal “antibodies” or appeared to be artifacts that were modeled into the presumed Y-shape via 3D reconstruction using computer algorithms. Each imaging method faced its own limitations, which cast doubt on the validity of the findings inferred from the data.
While the Y-shaped particles may exist within the serum of humans and animals, the evidence presented is not convincing. Even if these particles do exist, there is no experimental evidence demonstrating that they perform the functions attributed to them. The Y-shaped “antibody” is simply a logo—a representation of a hypothetical entity used to explain effects observed in the lab but not in nature. This logo has been used not only to support the “virus” hypothesis but also to promote the idea that vaccination is safe and effective, and to sell pharmaceutical treatments claimed to protect against disease. In the end, it became clear that the Y-shaped logo is simply a catchy mascot used to market the story and sell the products to the consumers. Whether such an entity actually exists in nature is still a mystery.
provided an in-depth look at Anthony Fauci’s West Nile “Virus.”The Bailey's also gave a special video presentation of one of journalist, essayist and novelist Paul Cudenec's essays “The corruption is real and sickening.”
presented an excellent re-examination of the “antibody” scam in her latest. served up some more enlightening Freedom of Information responses:Peste des Petits Ruminants “Virus”
“SARS-COV-2:”
looked at how the “SARS-COV-2” narrative has been flipped back from the lab-leak to an animal outbreak in order to create confusion.She also examined current propaganda in the headlines.
put the spotlight on vaccination with two of his latest articles. interviewed Michael Allen Bryant, a freelance journalist/activist and researcher, about the non-existent “pandemic.”He also did an expose on the Ebola “virus,” even using the trademark logo in the title (great minds think alike 😁).


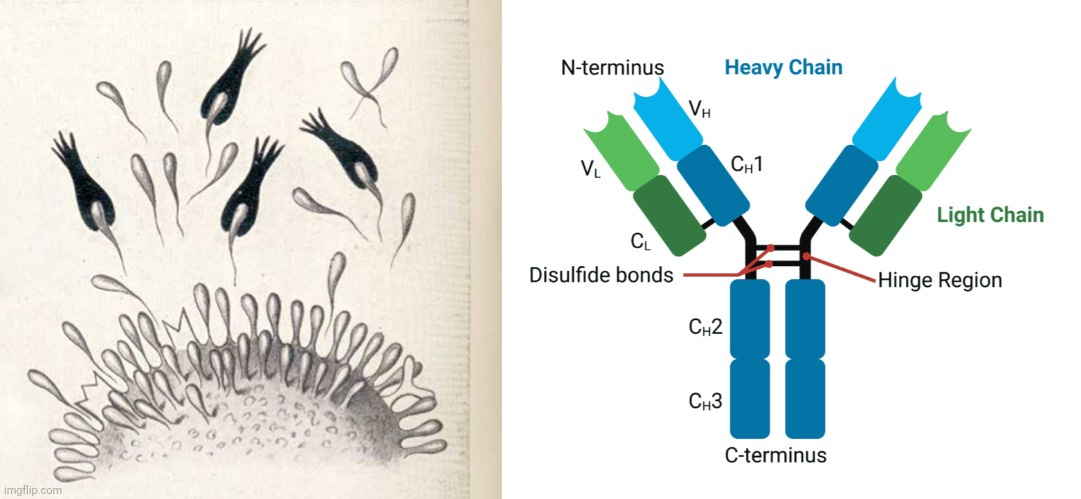
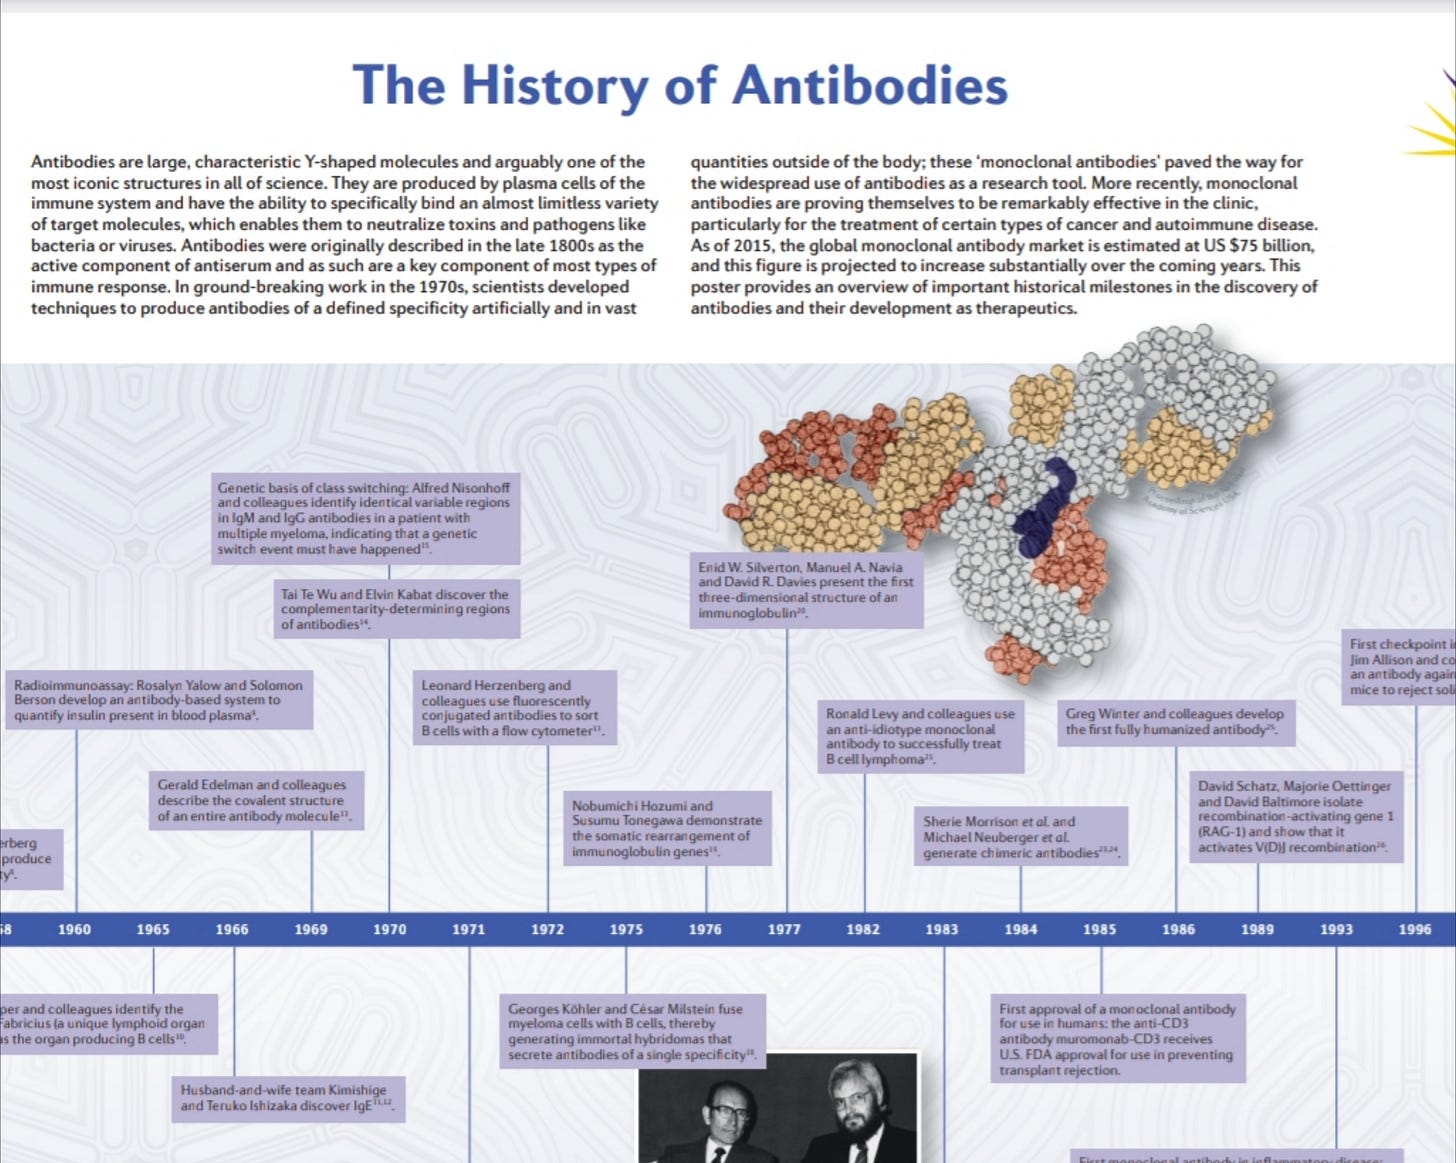
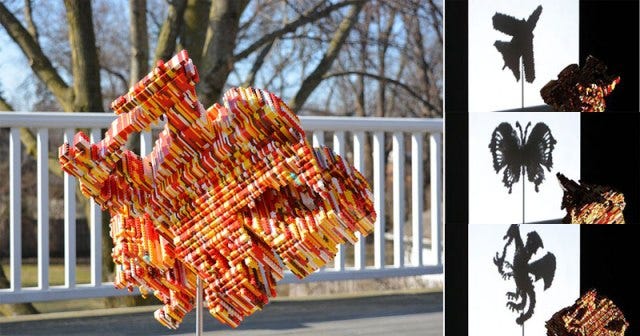
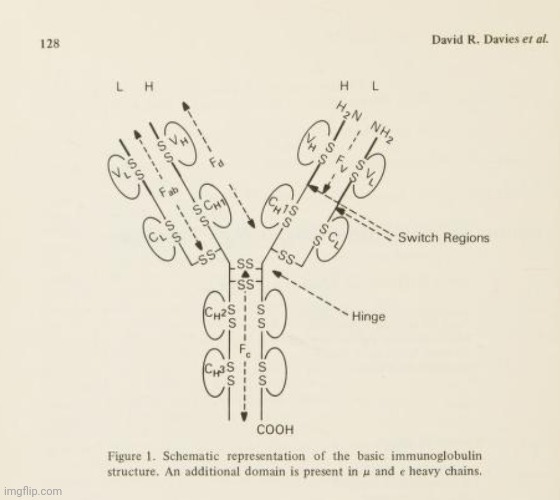
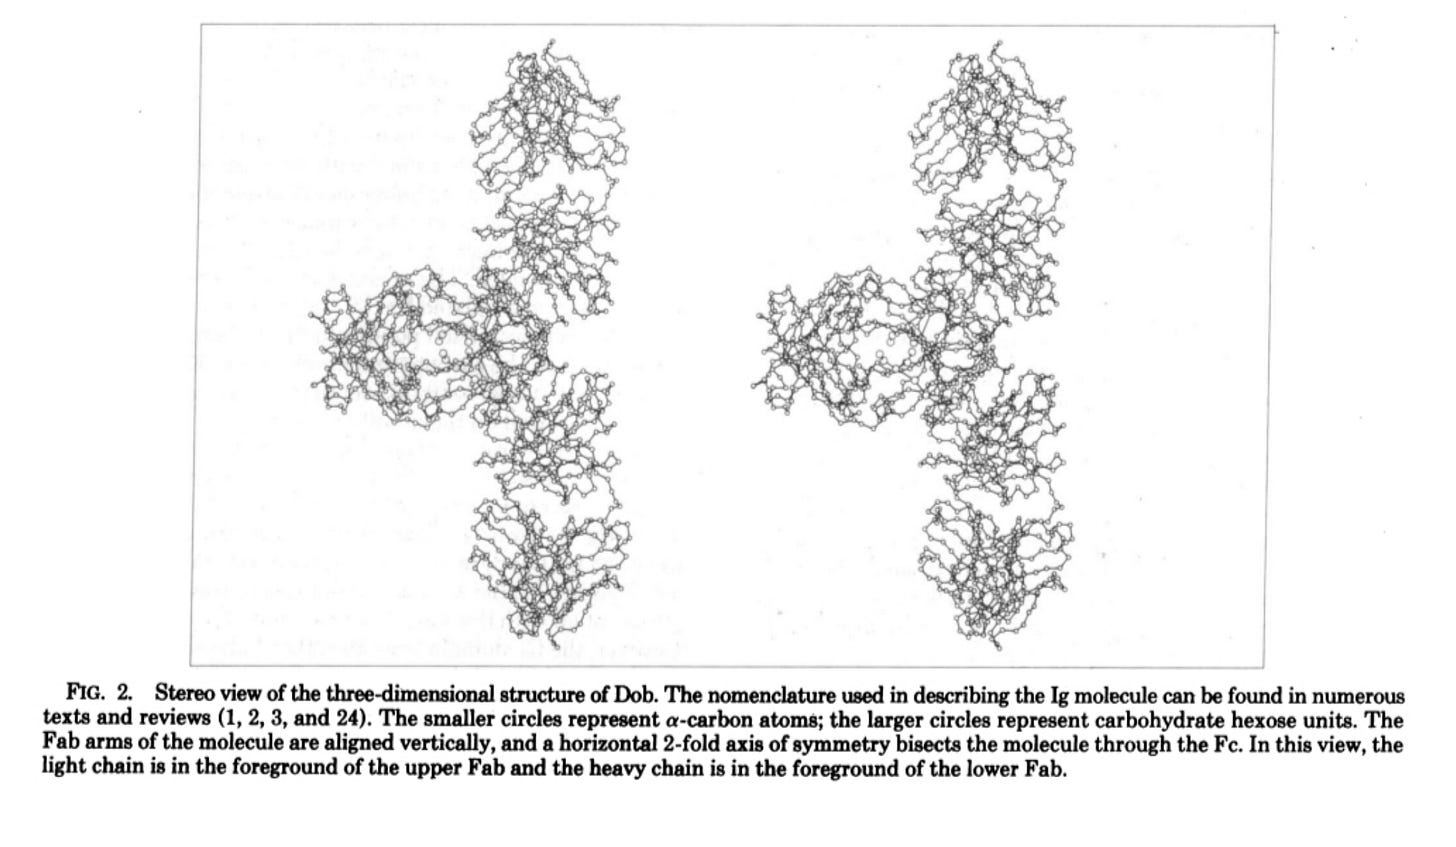
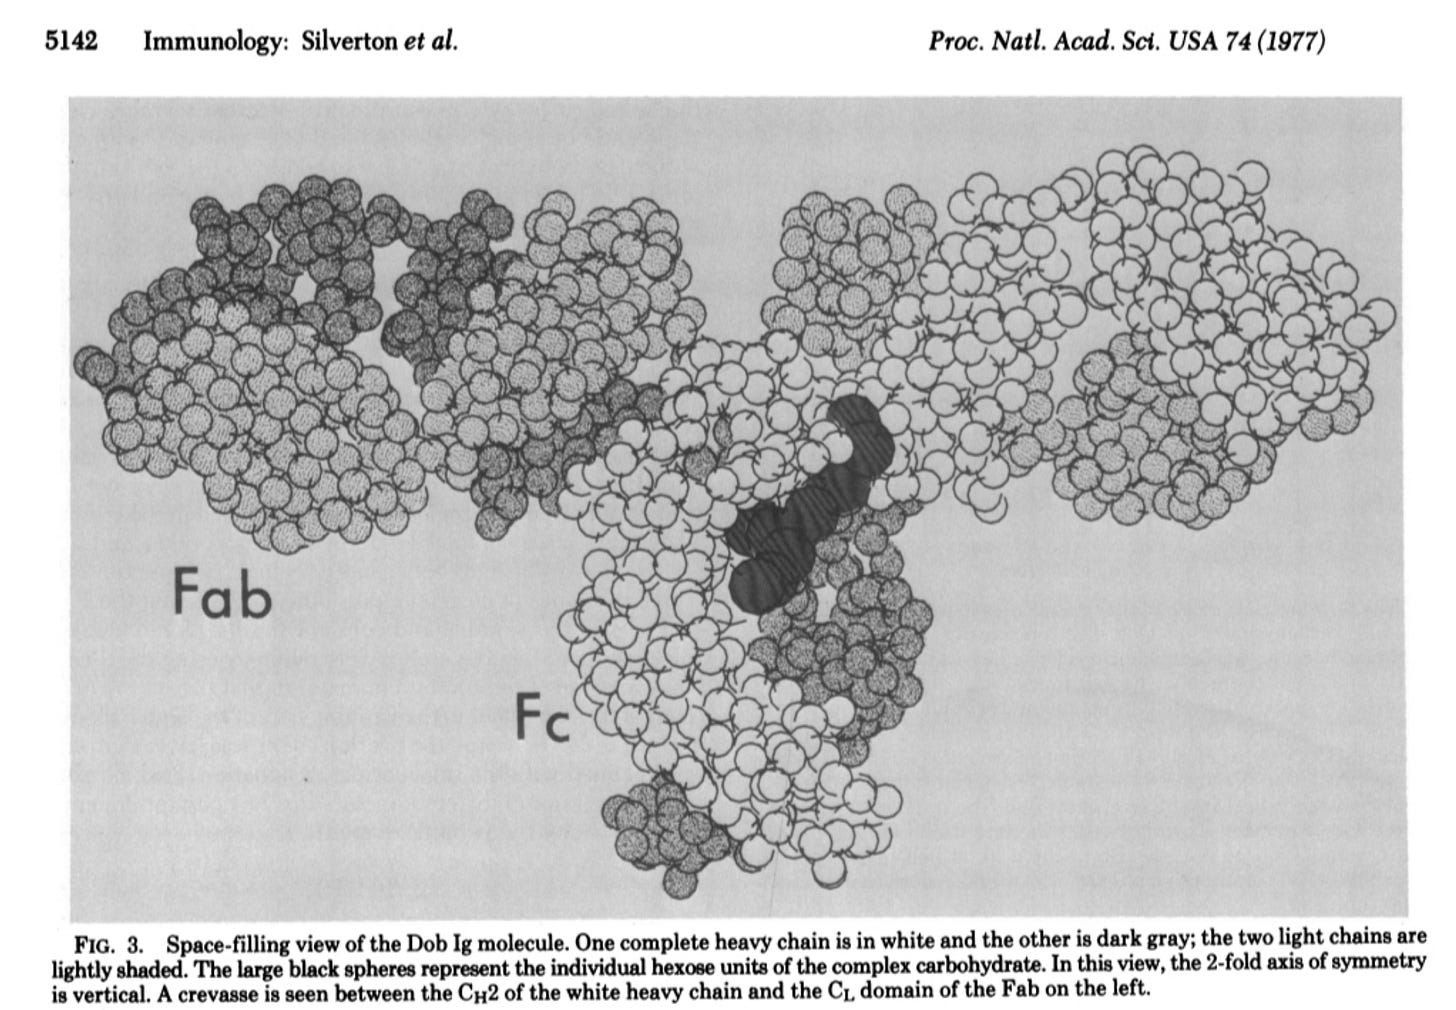
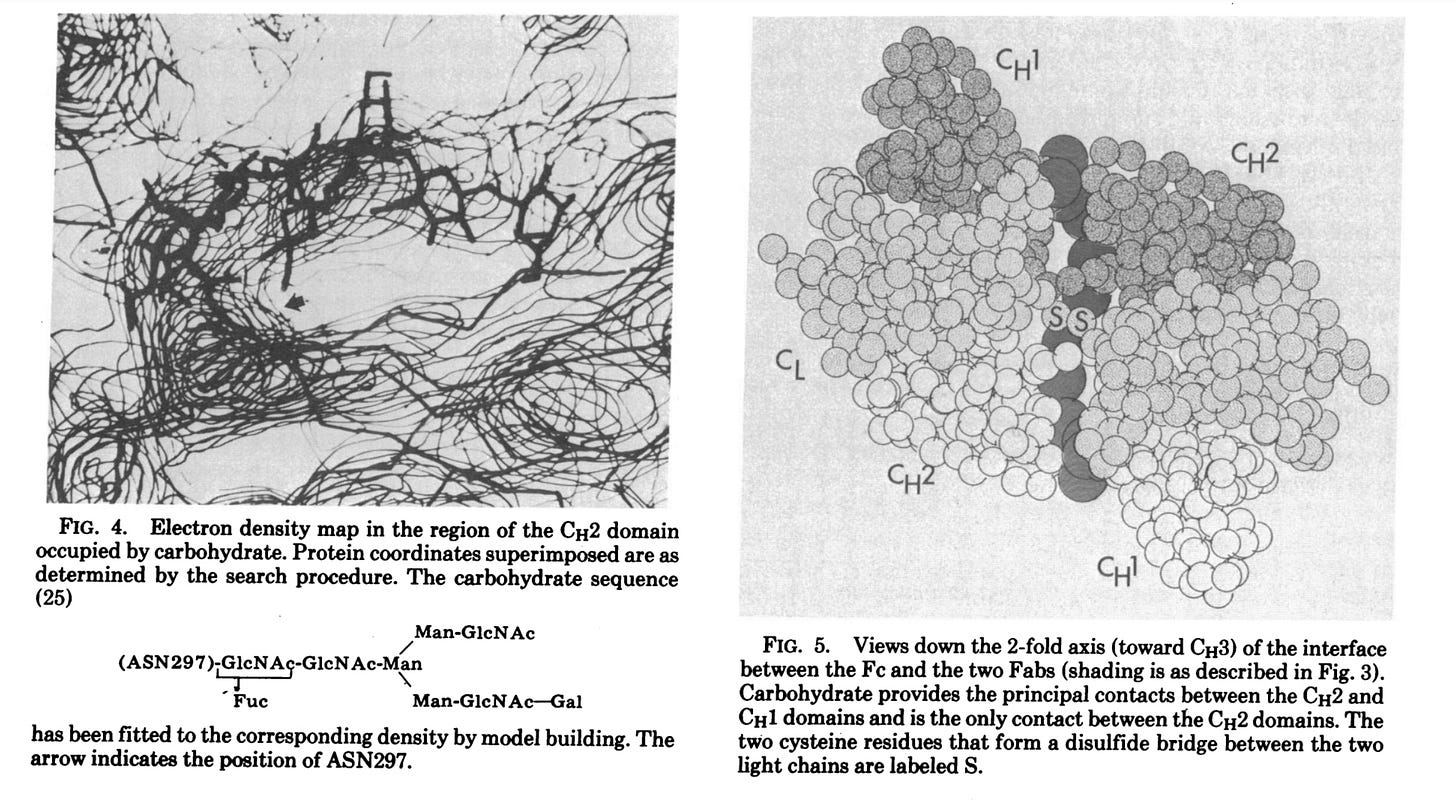
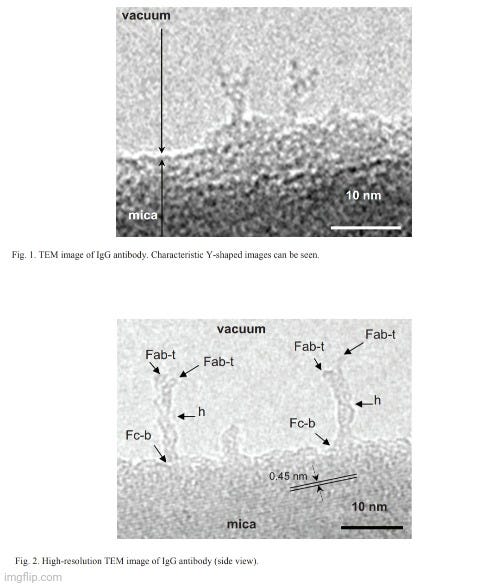
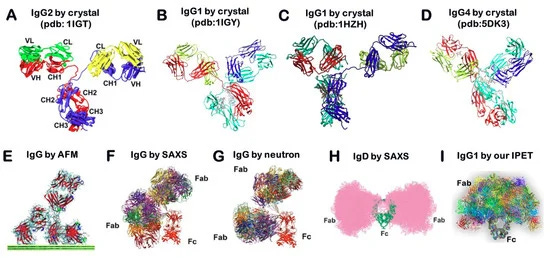
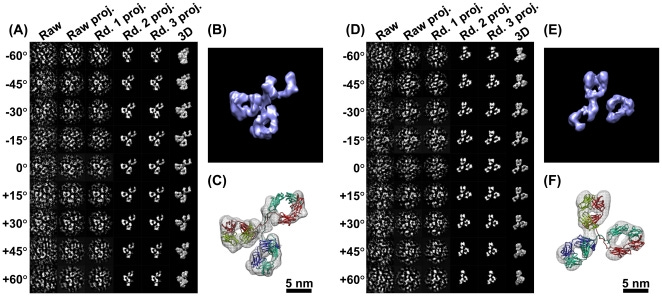
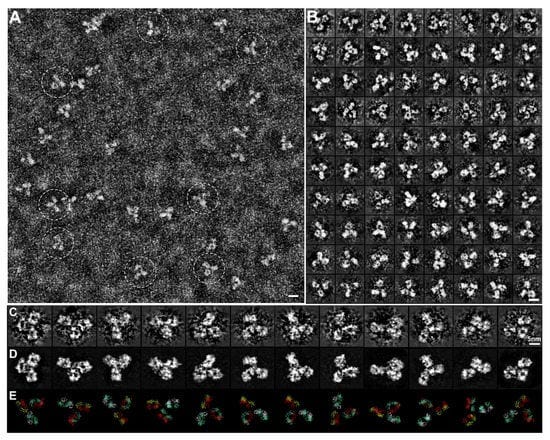
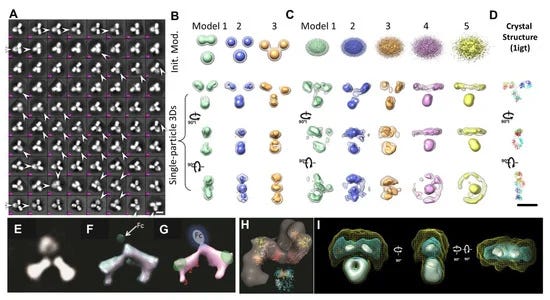
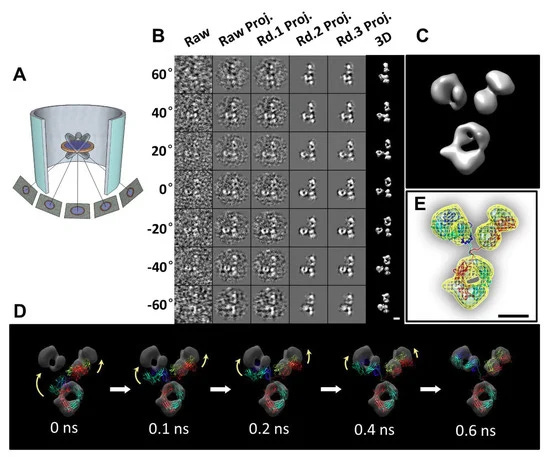
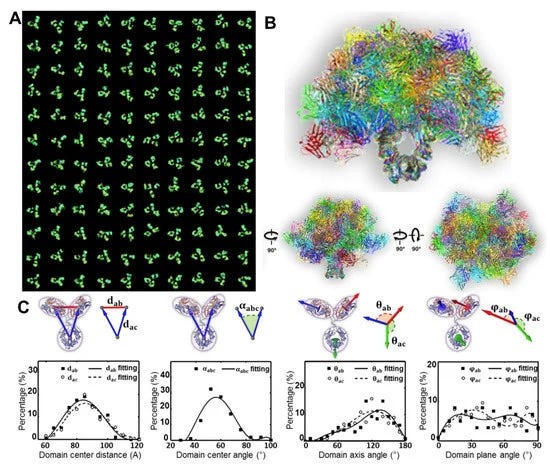
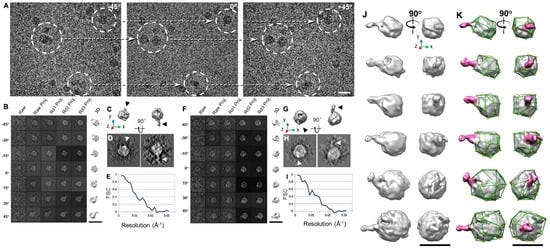
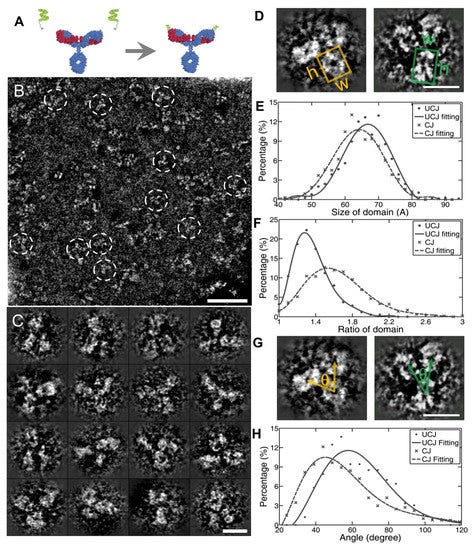
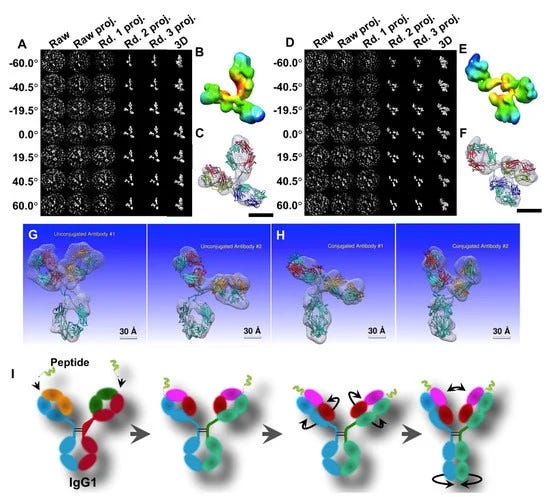
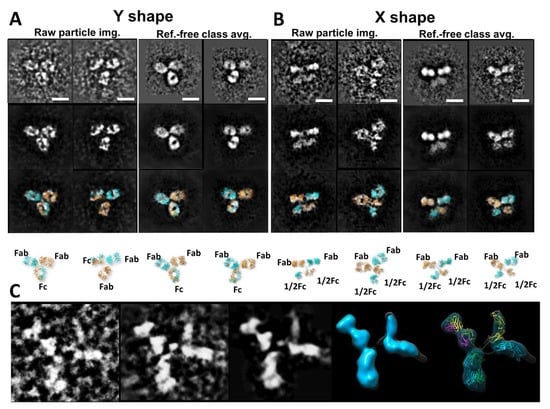


Thanks for all your research!
I wrote a song about antibodies, which may be appropriate to share here. 😁
https://www.youtube.com/watch?v=BQ3_wvUtgic
Only the most torturously hypnotized of materialists could believe in these "magic particles." The stacking of illogical assumptions to "explain" "antibodies" is almost impossible for me to follow.